QCM and QCM-D |
|
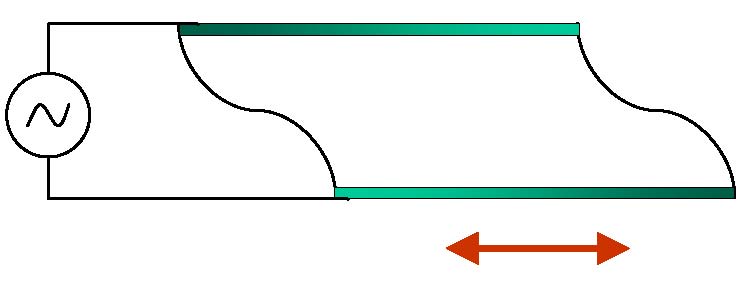
Quartz crystal microbalance, or QCM, relies on the ability of quartz crystals to change shape in response to the
applied voltage (reverse piezoelectric effect).
In particular, quartz crystals cut in a certain way will oscillate in shear-thickness mode in response to the applied voltage,
sending shear waves into the surrounding media. In the image on the left, such a crystal is shown schematically. It has a rectangular
cross-section at rest. Top and bottom surfaces will move in opposite directions when alternating voltage is applied.
|
|
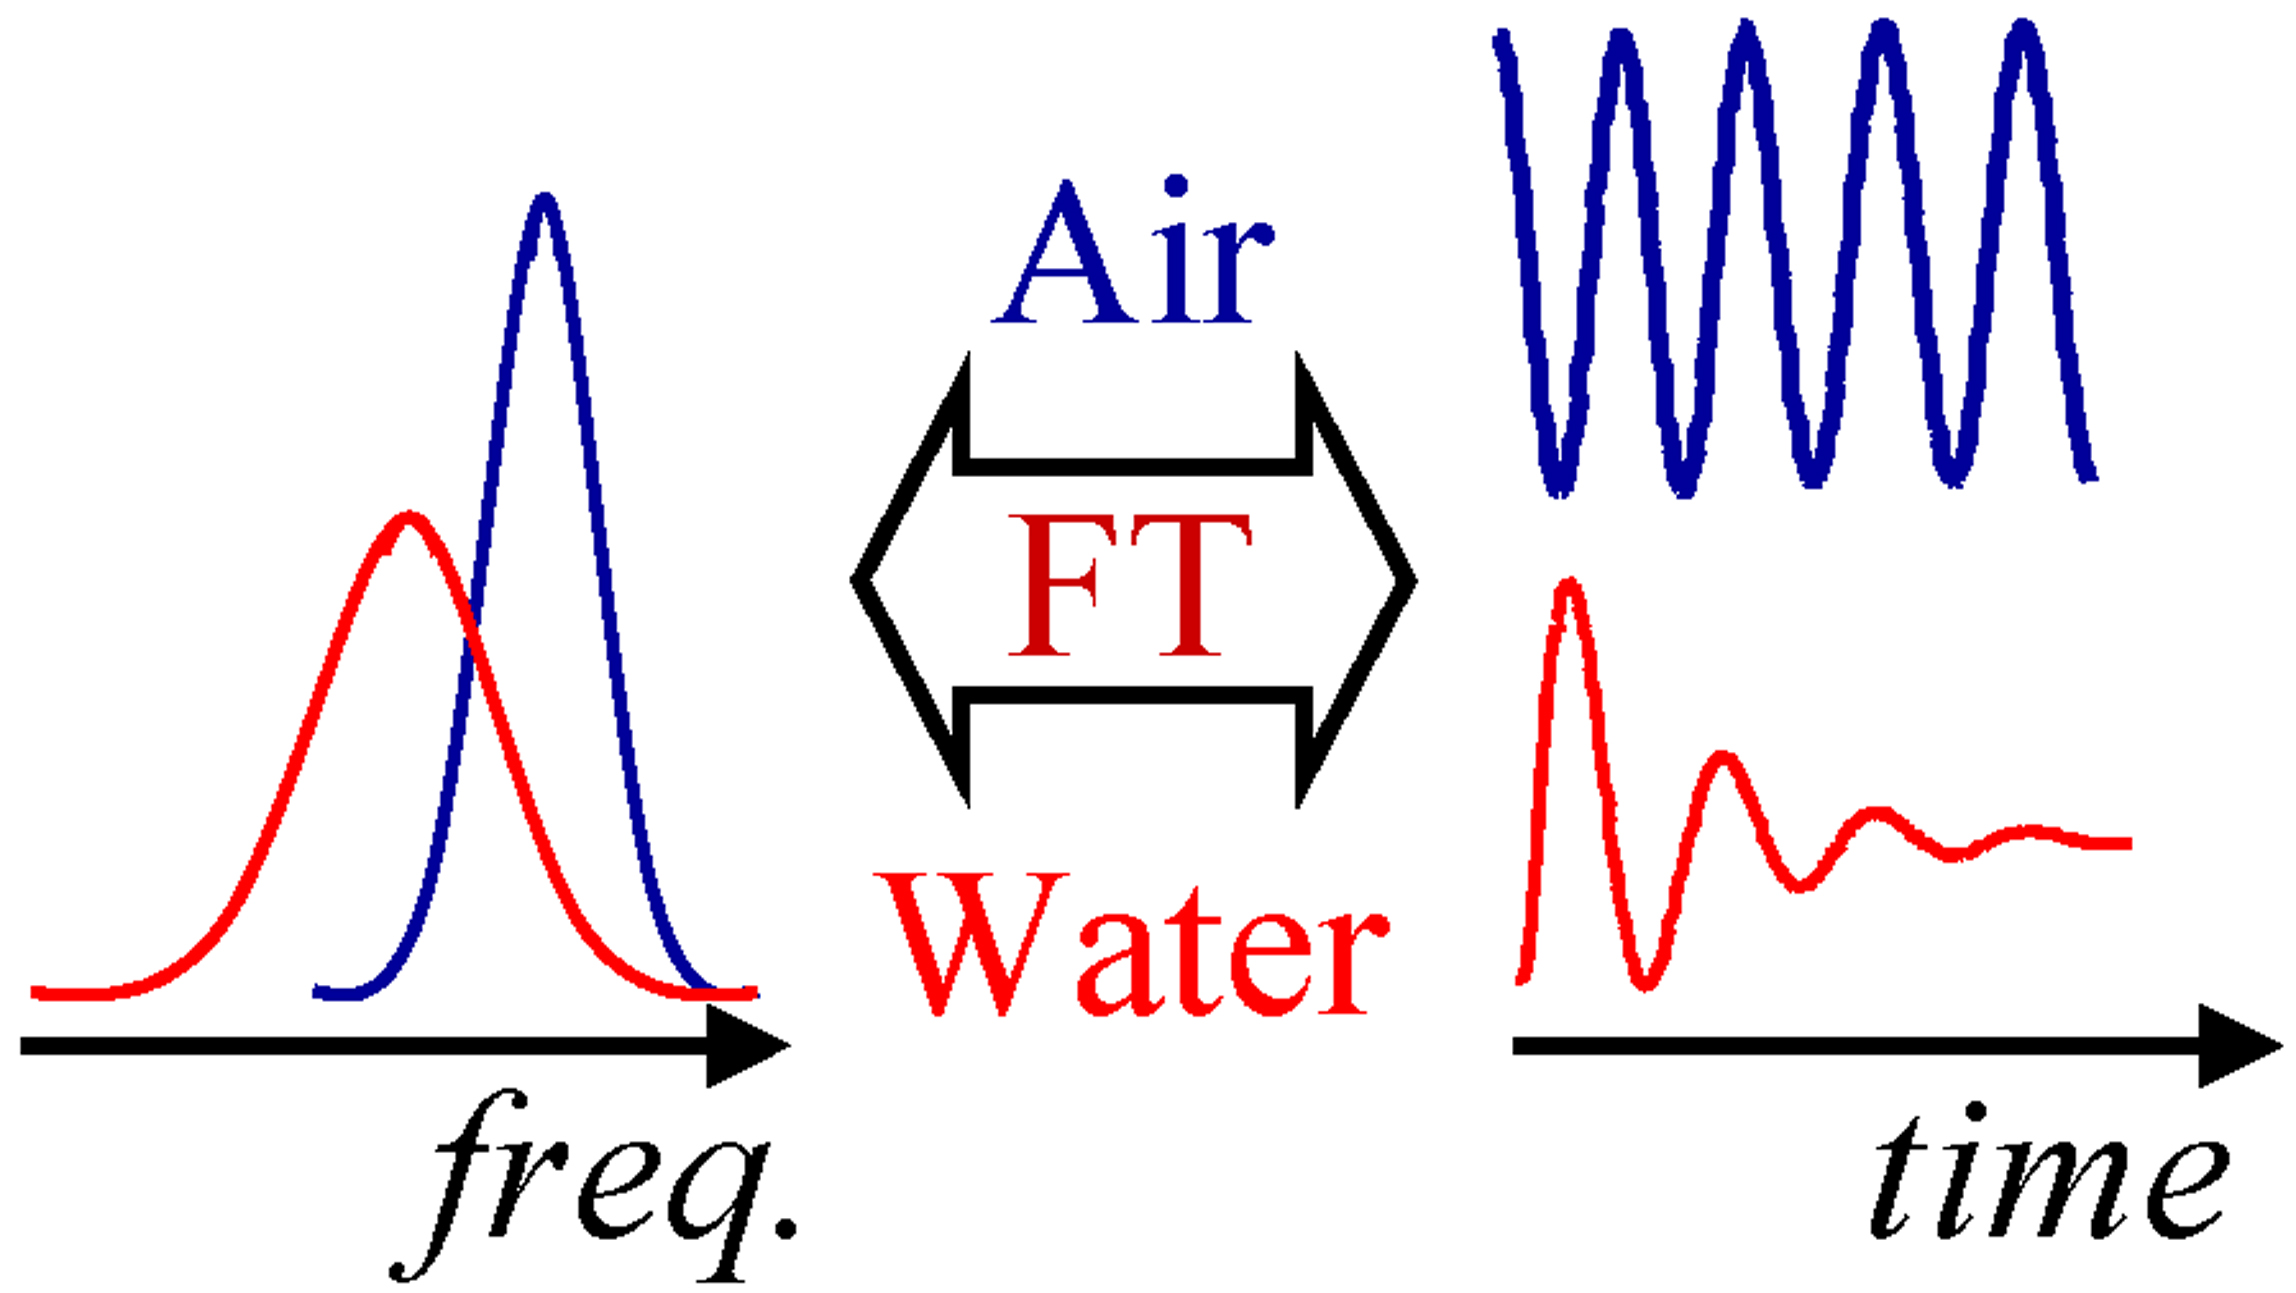
In a typical QCM or QCM-D measurement, the resonance frequency and bandwidth (half width of the resonance peak at half height) of a quartz crystal are
measured. Measurements can be done in the frequency domain (e.g., with an impedance analyzer) or the time domain (exciting the crystals
intermittently and measuring the decay of oscillations; this is the approach Q-sense took with their QCM-D system). Both approaches result
in two parameters (per overtone): resonance frequency f and bandwidth Γ. Bandwidth is defined as half-width of the resonance peak at half-height. The two kinds of measurements are related to each other via a Fourier transform (see the diagram on the left). Dissipation, favoured by Q-Sense, is defined as 2Γ/f
|
In vacuum, the resonance frequency is simply given by the thickness of the crystal through the relationship fn = nc/2d, where c is the speed of sound in quartz, n is the overtone order, and d is the thickness of the crystal. Dissipation in vacuum is due to the intrinsic viscosity of quartz.
However, both parameters depend on the environment of the crystal. For example, a crystal in air will oscillate at one frequency, while the same crystal in liquid - at another (red and blue curves in the diagram on the right). Note, that the widths of the resonance peaks also change. The change in the resonance frequency, as well as the change in bandwidth, upon transfer of a crystal from air to liquid, are described by the well-known Kanazawa-Gordon-Mason relation, which states that both are proportional to the square root of the liquid density times liquid viscosity.
See Borovikov 1976 Instruments and Experimental Techniques 19, 223-224; Kanazawa and Gordon 1985 Anal.Chem. 57, 1771-1772.
More information about QCM can be found here
|
QCM as a gravimetric technique: The Sauerbrey Relationship |

|
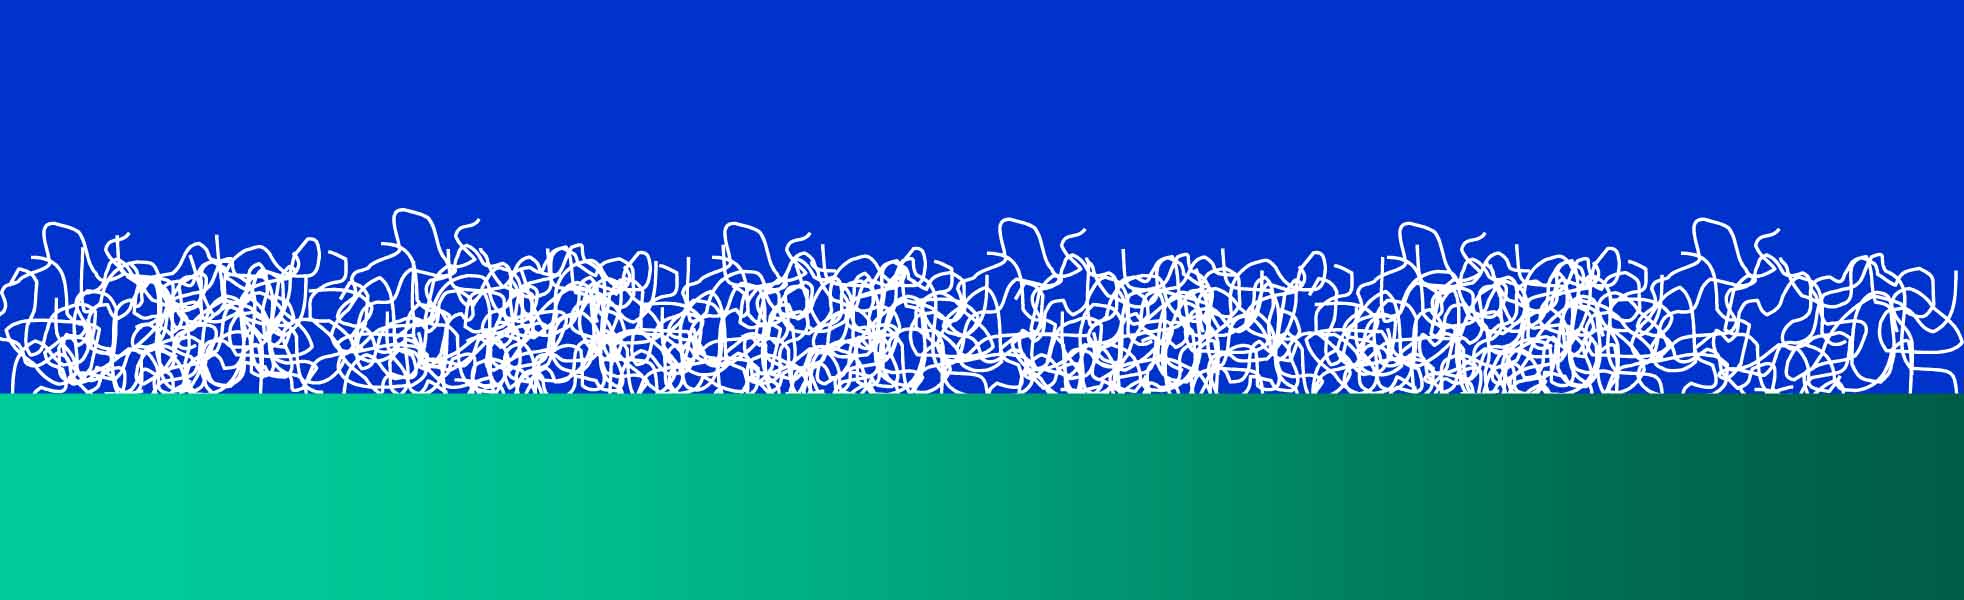
Left: An example of a homogeneous layer (black-and-white) on a QCM crystal (green gradient) in liquid (blue). There are many examples of such films, including polymers on surfaces, and lipid bilayers.
Compared with the bare crystal, the crystal + layer has a larger thickness. Therefore, the frequency decreases. Sauerbrey realized, that the change in frequency is proportional to the thickness of the layer, if its properties are similar to that of quartz. More generally, The frequency shift due to the film is proportional to the aerial mass density of the film, measured in the units of mass per unit area (e.g., ng/cm2).: Δf/n
= -constant * mfilm, where mfilm = ρfilm * dfilm, with dfilm film thickness and ρfilm its density.
|
Sauerbrey relationship is the basis for the name of the technique - microbalance - and its applications in thickness monitoring. Note, that the aerial mass density measured at different overtones (different frequencies) is the same (as it should be), so it is the frequency scaled by the overtone order n that appears on the LHS of the Sauerbrey equation above. It follows that in order to apply this equation, experimentally measured Δf should be independent of the overtone order n (Δf/n ~ const.), and the change in the dissipation due to the film should be negligibly small.
|
Laterally Homogeneous Viscoelastic Films. Rheology. |
|
If the film does dissipate energy (Δf/n <> const., and/or ΔΓ<>0), several cases may be distinguished. In the case of homogeneous films, energy is dissipated via internal friction (viscosity) within the layer. In that case, a complex shear elastic modulus of the film G = G(f)'+iG"(f) is defined, where the real part represents energy stored, and the imaginary part - energy dissipated; in general, both depend on frequency. The experimentally observed frequency and bandwidth shifts are then the real and imaginary parts, respectively, of the following expression:
Δf + iΔΓ ~ -constant*mfilm*(1-ρliqGliq/ρfilmGfilm)
|
This equation has been the basis of QCM data analysis for many decades. It is implemented in the Q-tools package of Q-sense and QTM (free download) of Diethelm Johannsmann. It's roots can be traced back to the work of Mason on torsional resonators and a number of other, early works. Details can be found in the book.
|
Laterally Heterogeneous Films. Hydrodynamics. |
|
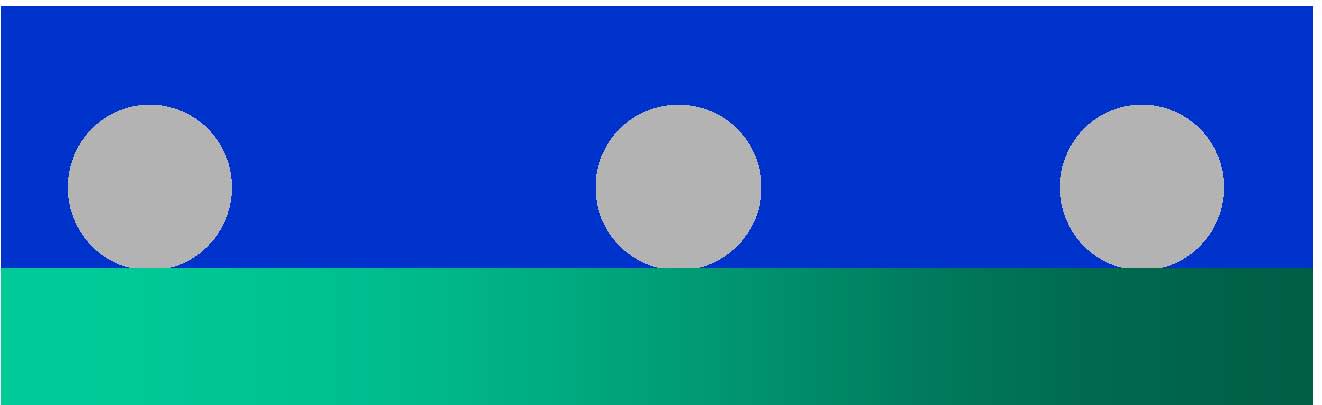
Another possibility is that dissipation arises due to the fact that the film is laterally heterogeneous, consisting of surface-adsorbed nanoparticles (grey spheres) on a QCM crstal (green gradient) in liquid (blue). These spheres can represent proteins, liposomes, virus or polymer particles, etc. The above model, applicable to laterally homogeneous films, does not tell us how to deal with such interfaces.
|
Our first step was to establish a quantitative relationship between the number of the surface-adsorbed particles and the frequency
shift Δf measured by QCM. To this end, we combined our network
analyzer-based QCM (IQCM, impedance-based quartz crystal microbalance) from Resonant Probes, GmbH with a Nanoscope atomic force microscope from Veeco. The
combination allowed us to visualize individual molecules of protein ferritin adsorbed on the surface of gold-coated quartz crystals while at the same time recording frequency and bandwidth shifts due to ferritin adsorption.
Crucial to the success of these experiments was the use of freshly purified ferritin, nearly free of dimers and free of higher order oligomers. In one of our manuscripts (Rojas et al. Anal. Chem. 80, 8982-8990, 2008) we discuss the influence of impurities in ferritin on the QCM results. The same manuscript contains the schematics of the AFM-QCM device.
|
|
|
|
|
|
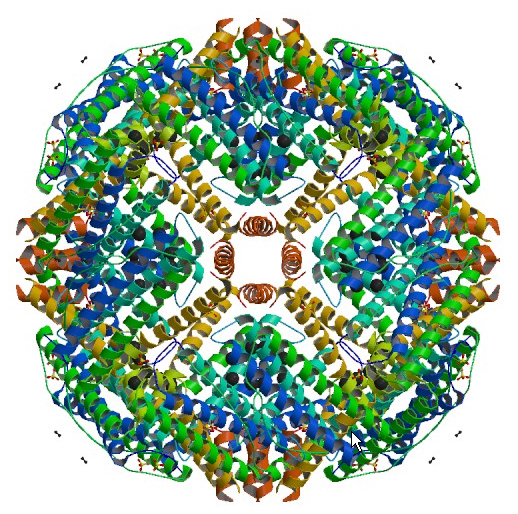
Ferritin is essentially a 12 nm protein ball with a 6 nm iron core. The protein part
of ferritin, apoferritin, is shown above. One such
monomer consists of 24 subunits.
|
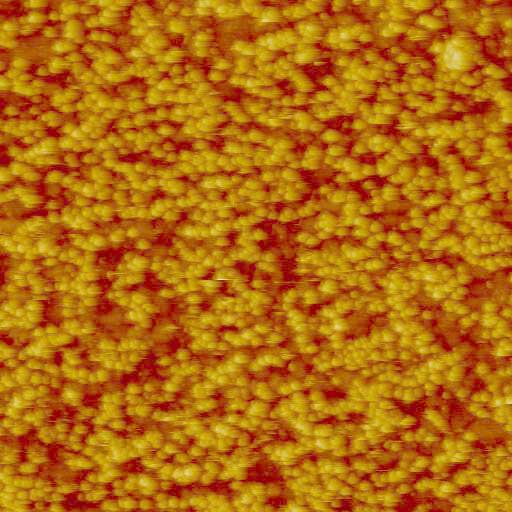
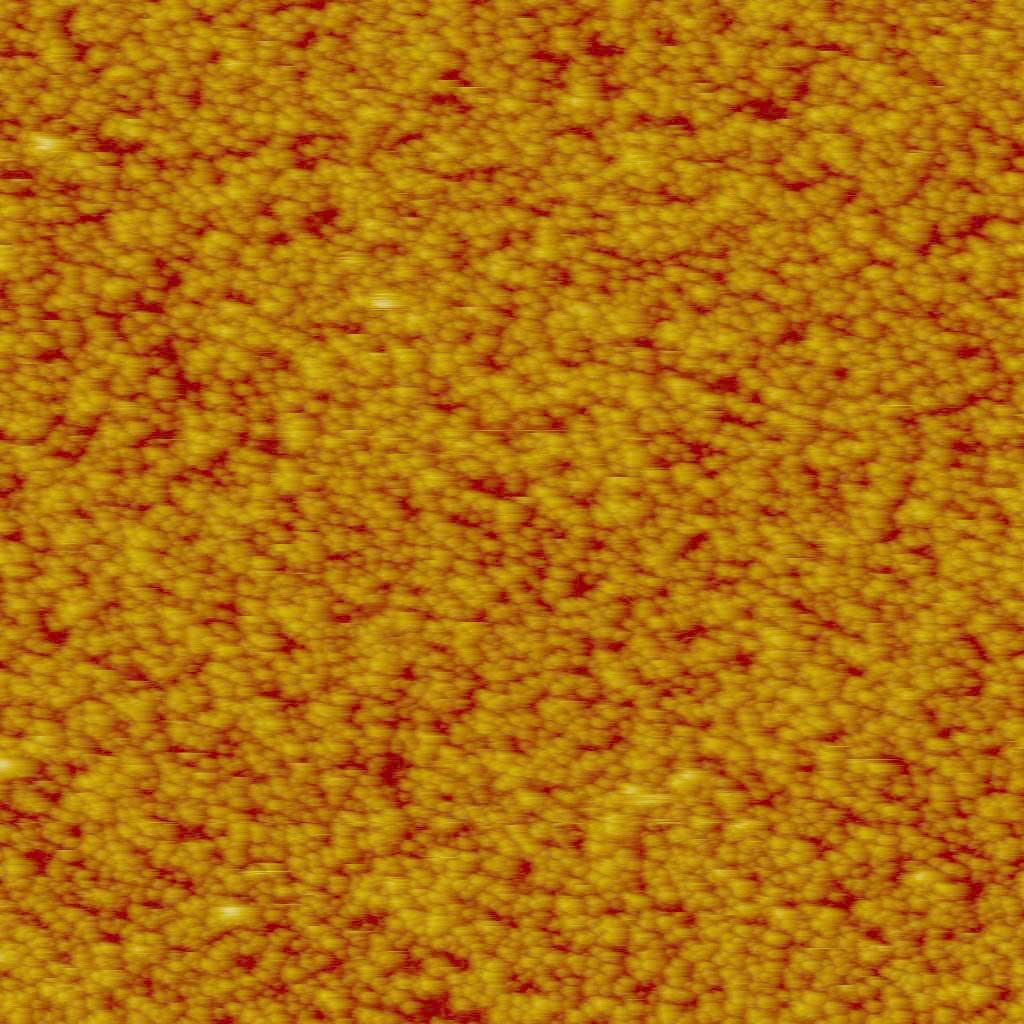
Tapping mode AFM images of ferritin adsorbed on the surface of gold-coated QCM crystals. Images taken at two different surface coverages are shown. They were acquired on the AFM-QCM instrument while the QCM data was being recorded. Left image: 2 um x 2 um x 50 nm. Right image: 3 um x 3 um x 50 nm.
|
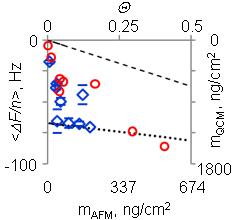
Frequency shift and the corresponding Sauerbrey mass (QCM) plotted vs. surface packing density calculated from AFM images. Data obtained with the purified ferritin are shown in red, with non-purified - in blue.
|
|
The system of adsorbed particles was modelled with finite element method (FEM) simulations:
|
|
|
|
|
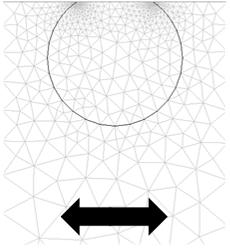
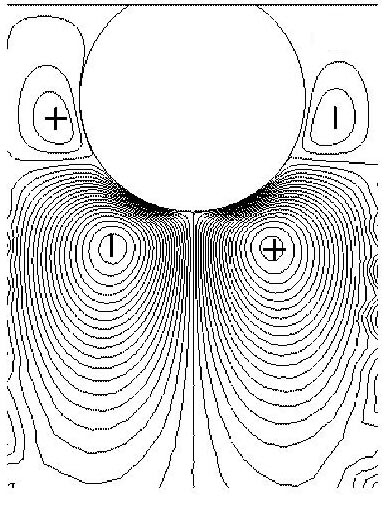
FEM calculations generate pressure profiles and flow velocities (middle figure) in the liquid around oscillating 12 nm truncated cylinders (left figure) that represent ferritin molecules. This information is then used to calculate the stress/speed ratio at the interface, which yields the frequency and bandwidth shifts by the small load approximation. They are described in detail in Johannsmann et al. Anal. Chem. 80, 8891-8899 (2008).
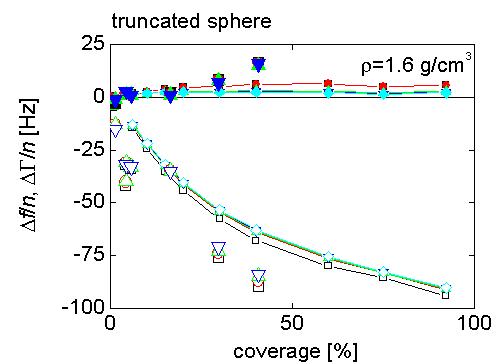
Right figure: frequency and bandwidth shifts observed experimentally with purified ferritin (large symbols), plotted as a function of surface coverage determined from AFM images, are compared with the results of the 2D finite element method (FEM) calculations (lines).
|
There is very good agreement between the data and the results of the simulations - including the small dissipation shifts observed for this nearly-Sauerbrey system. Note, that there are no adjustable (fitting) parameters here. This demonstrates, that taking into account hydrodynamic effects at the laterally heterogeneous interface, it is possible to reproduce the experimentally observed non-linear relationship between the frequency shifts and ferritin surface coverage, and the (small) dissipation that is observed. But, what is the origin of this dissipation?
|
|
Origin of the Dissipation in Laterally Heterogeneous Systems. |
|
Unlike in the case of homogeneous systems, where the energy is dissipated in the internal motions of the molecules comprising the film,
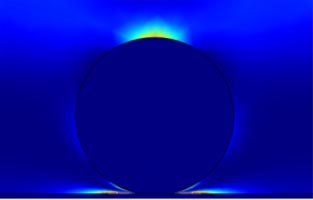
in the case of adsorbed particles, the energy is dissipated in the liquid around it. In the image on the left, the colours correspond to the amount of energy
dissipated: the lighter the colour, the more energy is dissipated in that region. As you can see, the particle is dark. Lighter areas correspond to the liquid around
the particle and the "linker" region between the particle and the surface.
How much energy precisely is dissipated depends on the properties of the linker
and the size of the particles. This mechanism originates from the rocking and rolling (twisting) motion of the particles in the flow field.
This mechanism explains a number of experimental observations, as discussed in our paper Johannsmann, Reviakine, Richter Anal. Chem. 2009. There are also applications, such as the one described below.
|
|
Model-independent analysis of QCM data on colloidal particle adsorption. |
|
|
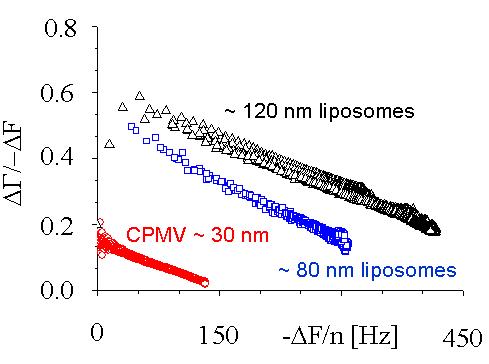
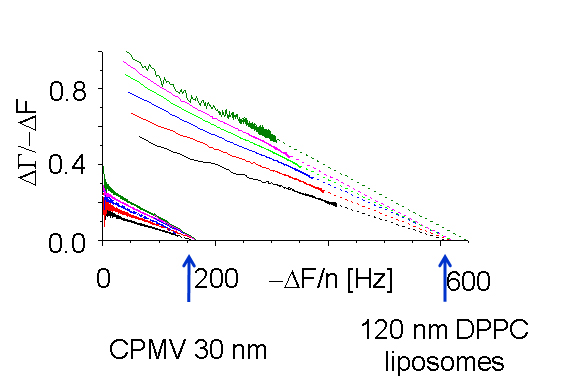
When nano-sized particles adsorb to the surface, the ratio of bandwidth shift to frequency shift decreases with the magnitude of the frequency shift but increases with the particle size. This separation allows the size of the surface-adsorbed particles to be measured. Interestingly, the decrease is linear. Plots for multiple overtones, extrapolated to the X-axis (frequency shift), share a common intercept. The value of the frequency shift at the intercept, where the bandwidth shift is zero, can be converted to Sauerbrey thickness. It compares favourably with the size of the particles in solution, as shown under the image below.
|
|
|
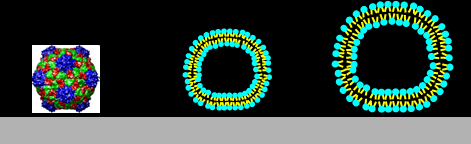
Left-to-right:
Cow pea mosaic virus, CPMV, ~ 30 nm; DPPC liposomes, ~ 80 nm and ~ 120 nm.
Particle sizes calculated from the QCM measurements: 29, 80, 110 nm.
CPMV experiments were performed by Ralf Richter using a Q-Sense system, and CPMV itself was prepared by Nicole Steinmetz. FEM calculations were performed by Diethelm Johannsmann.
|
|
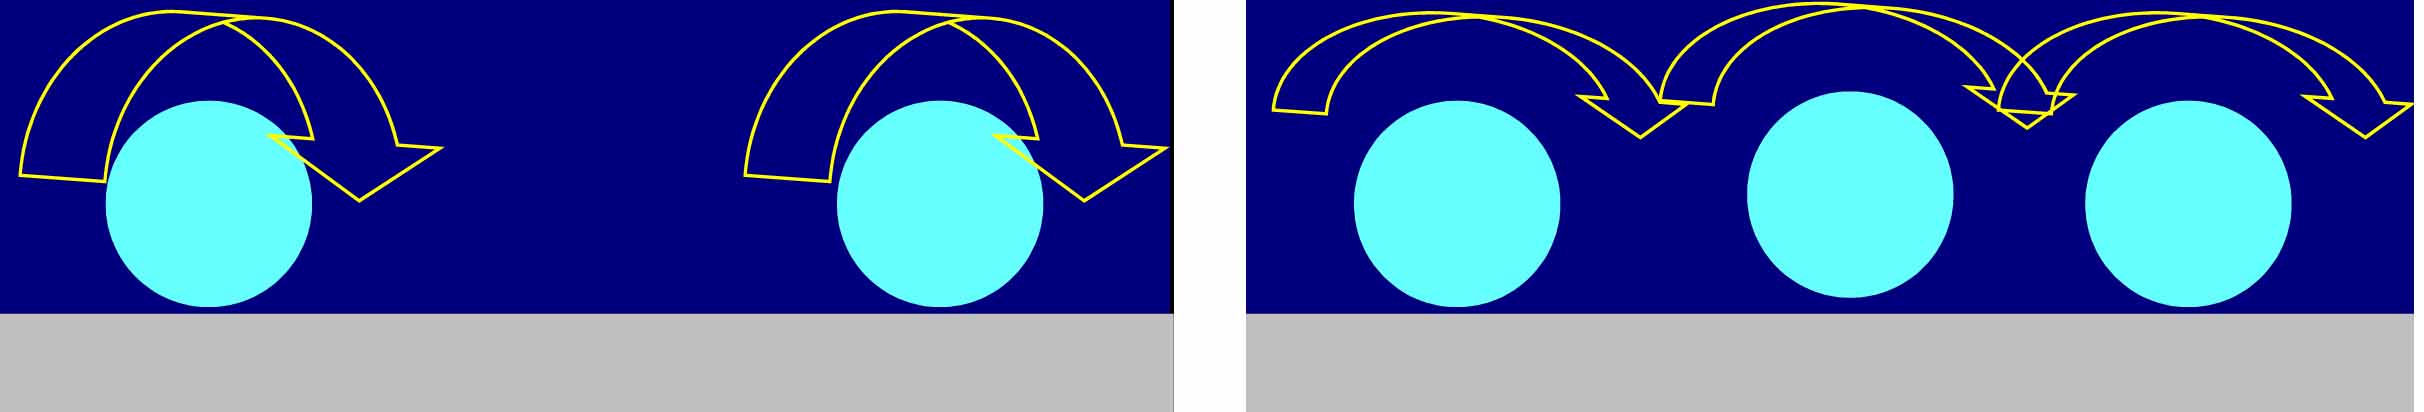
It is relatively easy to understand why the dissipation per particle (this is what the dissipation shift to frequency shift ratio represents) should decrease with coverage. This is illustrated in the figure below: as more particles appear on the surface, the hydrodynamic effects diminish, reducing the amount of energy dissipated per particle. FEM calculations support this argument, reproducing the experimental data (see Tellechea et al. Langmuir, 25, 2009). What is not clear is why this decrease should be linear.
|
|
|
Measuring Adsorbed Liposome Deformation with QCM. |
This ability to measure the height of the adsorbed particles allowed us for the first time to measure deformation of nanosized adsorbed liposomes.
|
|
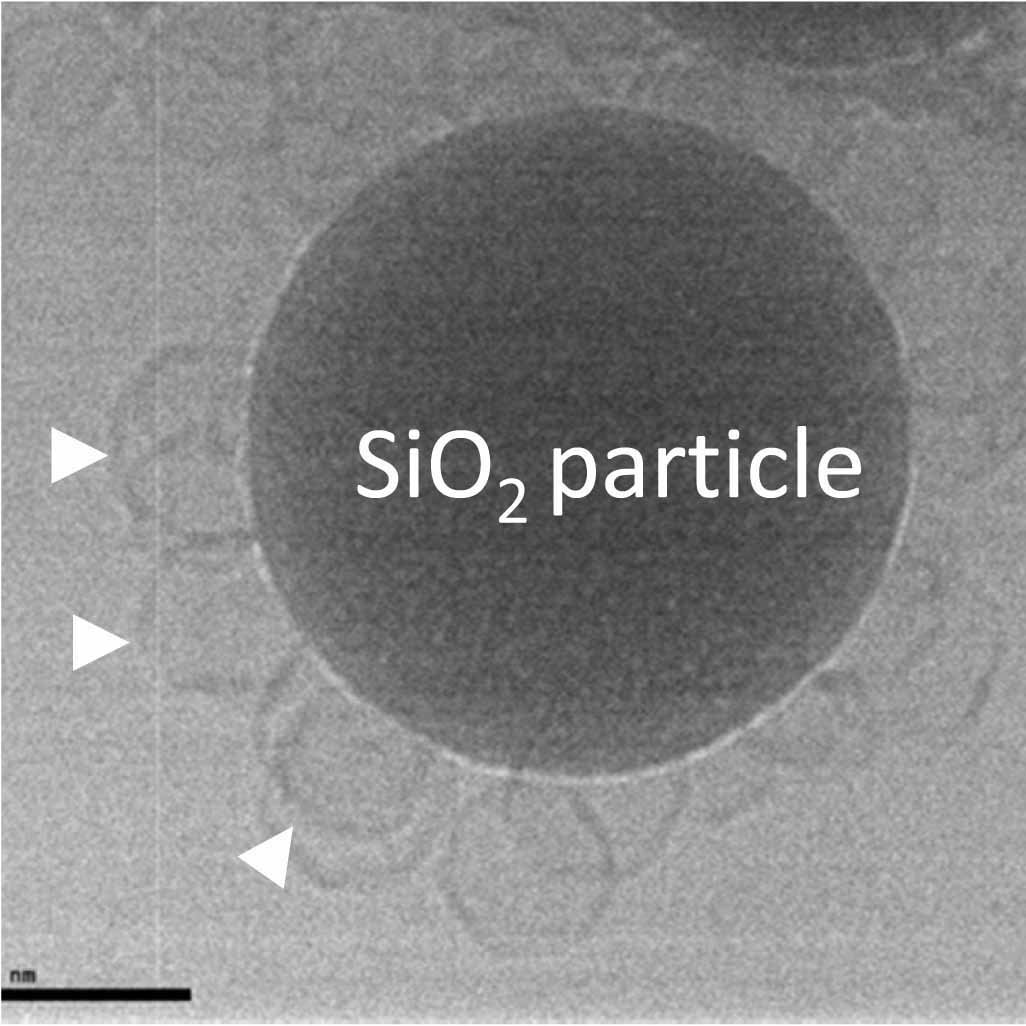
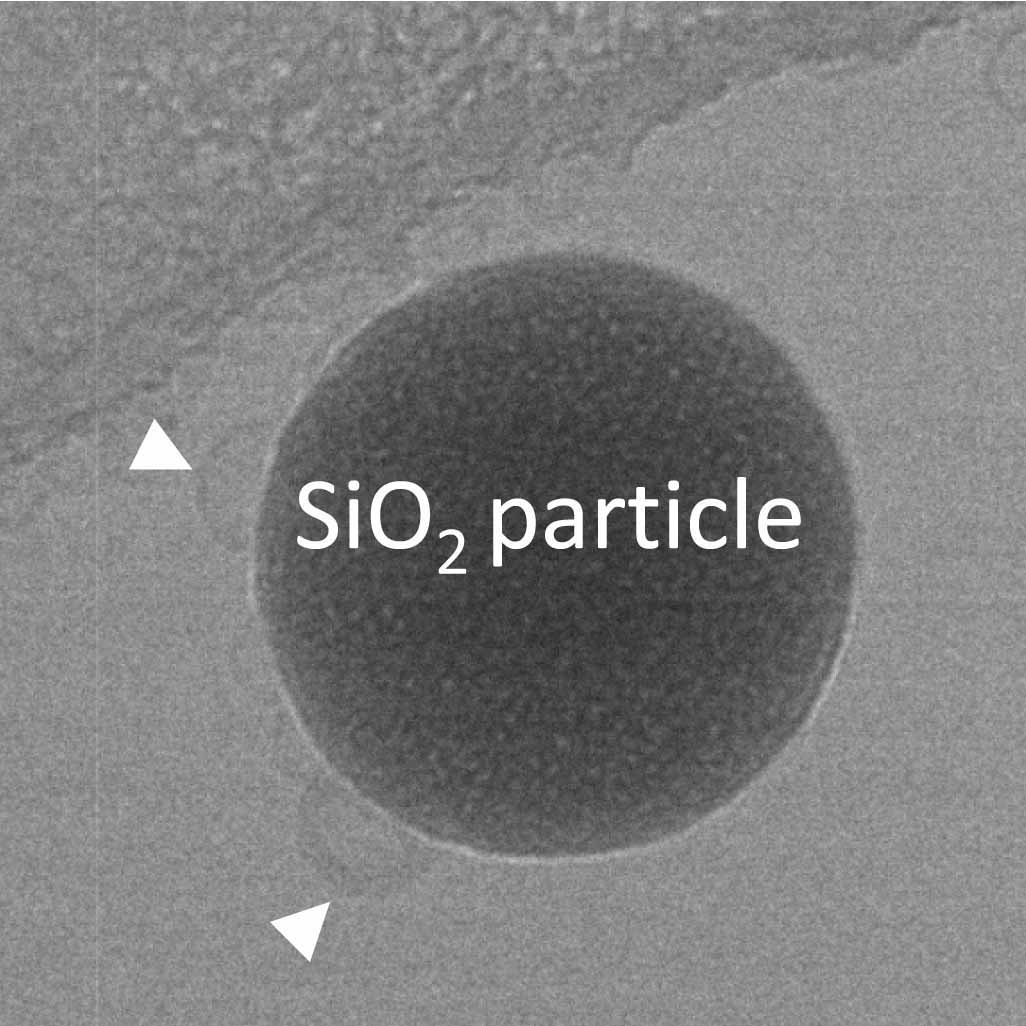
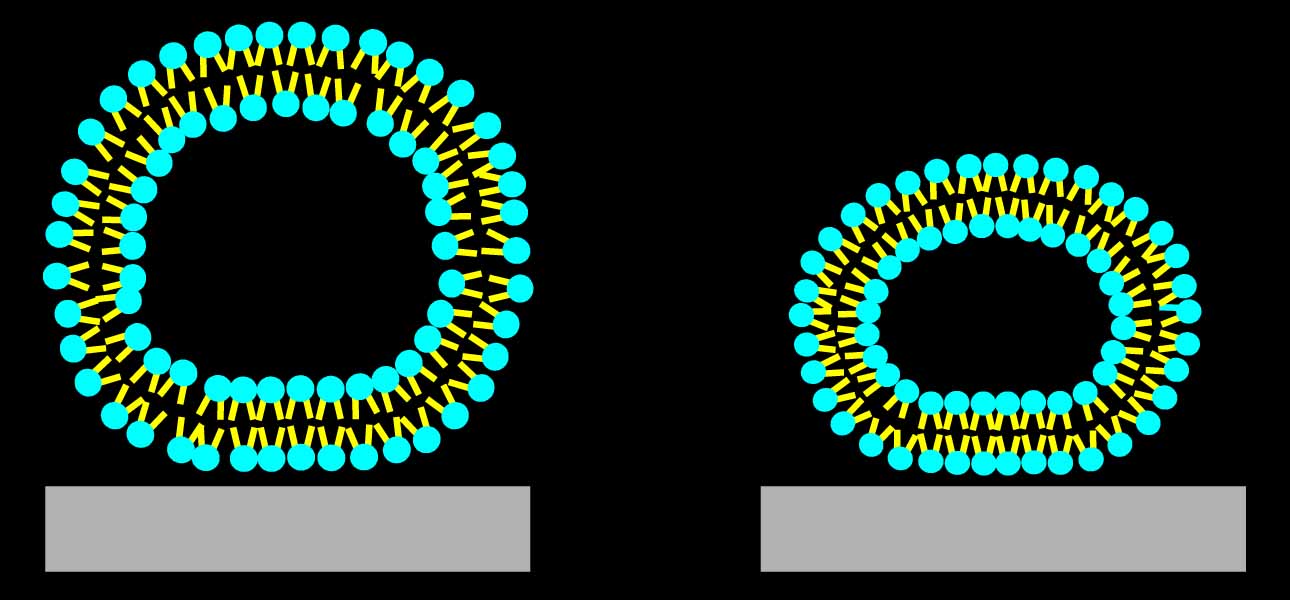
To demonstrate, that we can measure adsorbed liposome deformation, we investigated adsorbed liposome height as a function of the bilayer bending modulus. Images on the right illustrate the principle behind these measurements.
Top: Cryo Transmission Electron Microscopy images performed n my group by Edurne Tellechea and Marta Gallego of DPPC liposomes (left) and DOPC liposomes (right) adsorbed on silica particles.
Bottom: illustration of the adsorbed vesicles. DPPC ones are stiff and deform little, if at all, while DOPC nes are soft, and become dome-shaped due to the deformation.
The bending moduli of the two lipids are ~ 10-19 and ~1-19 J, respectively.
|
|
|
|
|
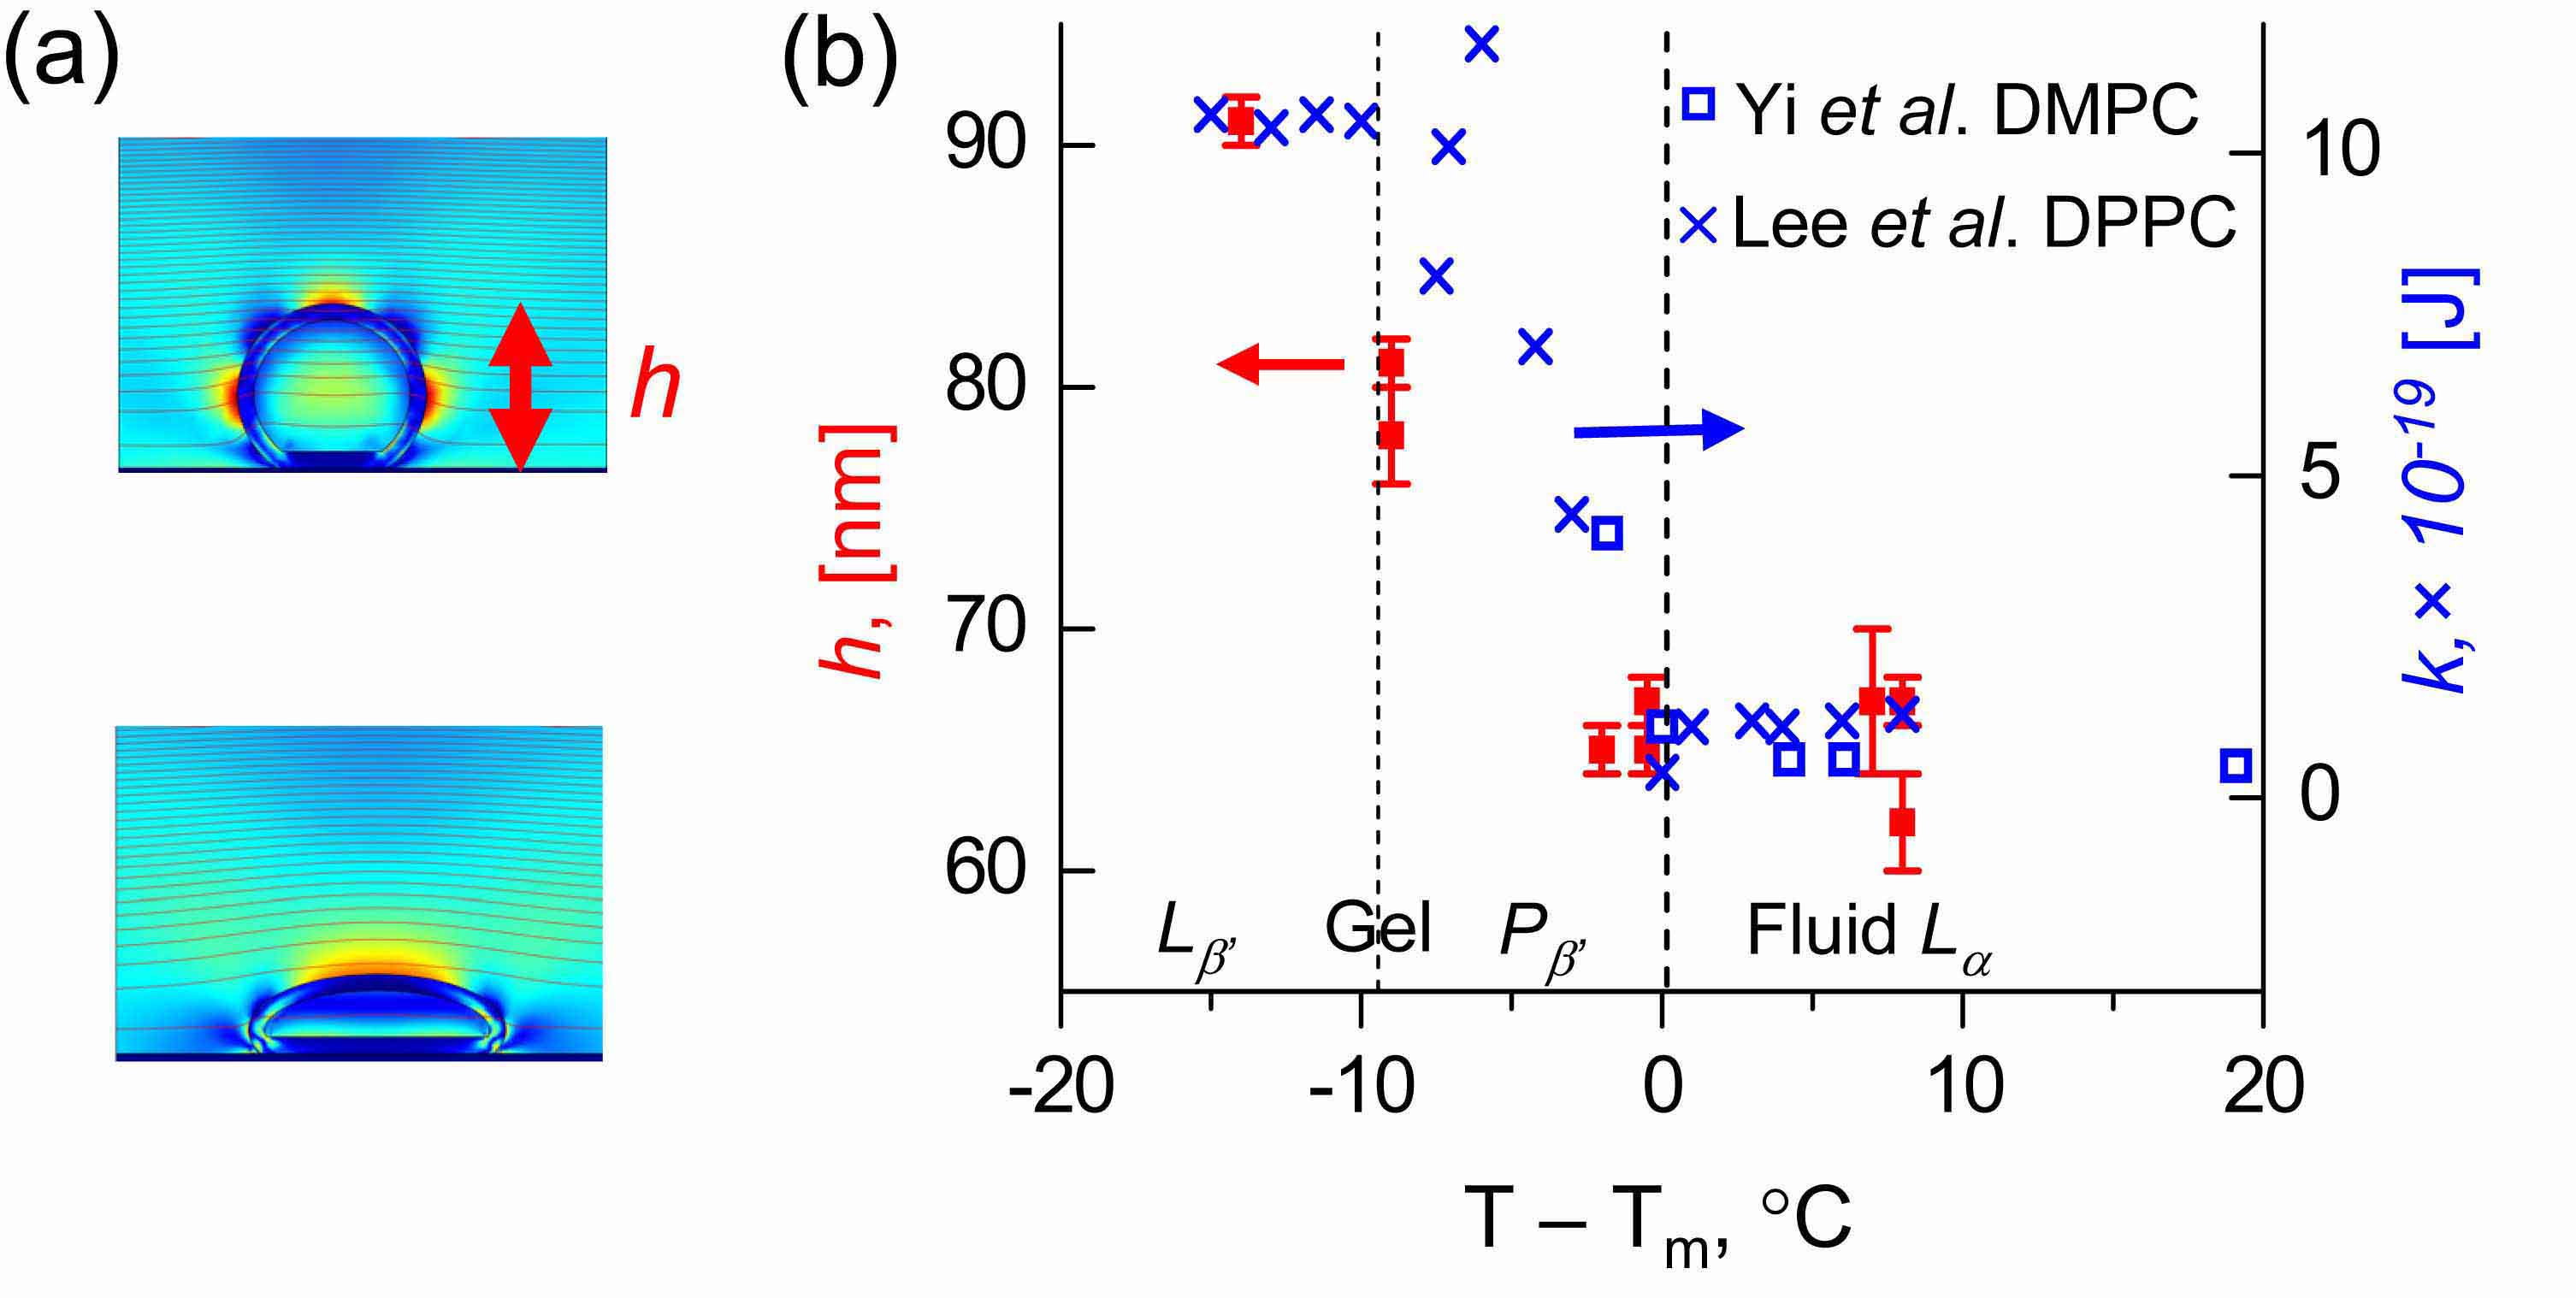
(a) Shapes of the adsorbed liposomes for two different values of liposome-surface interaction strength (adhesion scaled by the bending modulus). Color represents local dissipation rate per unit volume, calculated with the FEM simulations. Brighter areas correspond to higher rates.
(b) The plot of the layer thickness h, determined from the QCM measurements as described above, as a function of temperature (relative to the main transition temperature), for DMPC liposomes adsorbing on TiO2 (red symbols). Bending moduli are plotted with blue symbols. The layer thickness changes rapidly across the transition temperature, as expected from what is known abou the deformation. FEM simulations reproduced experimental results, as discussed in our paper in J. Chem. Phys. 136, 084702 - 084705 (2012).
|
|
|
|
|
|
|
|
|
|